Browse Articles
Conditioning Medicine
International bi-monthly journal of cell signaling, tissue protection, and translational research.
Current Location:Home / Browse Articles
Preclinical evaluation of circadian rhythm in ischemic stroke outcomes
Time:2022-03-12
Number:8727
Pradip K. Kamat1, Mohammad Badruzzaman Khan1, Kristofer Wood1, Shahneela Siddiqui1, Daniel R Rudic2, Krishnan Dhandapani3, Jennifer Waller4, David C. Hess1
Author Affiliations


- 1Departments of Neurology, Medical College of Georgia. Augusta University.
- 2Department of Pharmacology, Medical College of Georgia, Augusta University.
- 3Department of Neurosurgery, Medical College of Georgia, Augusta University.
- 4Department of Biostatistics & Data Sciences, Medical College of Georgia. Augusta University.
Conditioning Medicine 2021. 4(6):280-284.
Abstract
Stroke is a leading cause of disability and death worldwide. There is evidence that there is a circadian rhythm in stroke with peak occurrence in the morning (6 to 10 am). However, it is not clear if the size of infarcts and the outcome of stroke also varies during the 24-hour period. We hypothesized that the size of cerebral infarct and outcome from stroke would show circadian variation in a mouse suture occlusion model. Seven to eight-month-old C57BL/6J (n =10-12 mice/group) mice were randomly assigned to undergo middle cerebral artery occlusion (MCAO) for 60 minutes at different time points during the 24h day following zeitgeber time at ZT0, ZT6, ZT12, and Z18. Cerebral blood flow was monitored by Laser Speckle Contrast Imaging at baseline after occlusion, and again at 24h post-occlusion. Neurological deficit was observed by using Bederson score at 24h and 48h. The corner test was used to detect unilateral abnormalities in sensory and motor functions in the stroke mice at 48h. To estimate brain infarction, 2,3,5-tryphenyltetrazolium chloride staining was performed 48h after stroke and the infarct area was quantified using NIH-Image J software. We did not find a significant difference in cerebral blood flow at any time point. There was a significant decrease in neurological deficit as assessed using the Bederson Score from 24h (1.82 ± 1.11) to 48h (1.10 ± 0.12) in the ZT18 (midnight) period (p = 0.0025), however there were no differences between groups at 48h. In the corner test, we found right turn preference significantly higher (p = 0.0348) at noon/ZT06 (9.5 ± 1.06) compared to the fully awake (5.5 ± 4.06) (midnight, ZT18) period and ZT0 (6 am, 4.8 ± 0.97, p = 0.0087). Similarly, the infarction volume was significantly higher (p = 0.0220) during the sleep (ZT06, noon) period (35.22 ± 20.77) than when the ischemic mice were fully awake during the midnight/ZT18 period (15.68 ± 7.54). This is the first report demonstrating that mice have larger infarcts and worse short-term outcomes during their sleep period (noon/ZT06) than during their awake period (midnight/ZT18).
Keywords: Stroke, Circadian rhythm, Cerebral blow flow, Neurological deficit
Introduction
Ischemic stroke is one of the leading causes of death and disability in the United States. Cardiovascular events such as myocardial infarction (Muller et al., 1985), sudden cardiac death (Muller et al., 1987), and stroke (Elliott, 1998) show variations throughout the 24-hour cycle, notably a peak in the morning between 6 am and noon. There are wake/sleep variations in the activity of the renin-angiotensin system, blood volume, the hypothalamic-pituitary-adrenal axis, and the coagulation system (Smolensky et al., 2017).
All species, including humans, exhibit biochemical, physiological, and behavioral variations throughout the 24-hour cycle. These circadian rhythms are aligned with the wake/sleep cycle. The pacemaker or “central” clock resides in the suprachiasmatic nucleus (SCN) in the hypothalamus. The SCN receives input from melanopsin photopigment-containing ganglion cells in the retina. There is also a” peripheral” molecular clock system in each cell of the body, including cells of the vascular system. All cells have four families of clock genes [Clock, Bmal-1, Period (Per) and Cryptochrome (Cry)] that cycle every 24 hours in a transcriptional/translational feedback loop (Thosar et al., 2018). CLOCK and BMAL-1 increase the transcription of per and cry genes and the PER and CRY proteins then feedback to reduce transcription of their genes, cycling in a 24-hour period. In a mouse study, 43% of protein-coding genes showed circadian variation in an organ specific manner, with the expression of many of these genes having a “transcriptional rush hour” before dawn (Zhang et al., 2014).
While strokes are more likely to occur in the morning between 6 am and noon, it is not clear whether the size and severity of stroke vary by time of day and night. To date, there is still an absence of a simple time course analysis of stroke infarct in the mouse in the middle cerebral artery occlusion (MCAO) model. We hypothesized that stroke size and severity would show circadian variation. To investigate this hypothesis, we performed MCAO in mice at different time points of the 24-hour cycle at 6 hour intervals corresponding to zeitgeber times of T0 (6 am), T6 (12 pm-noon), T12(6 pm) and T18 (12 am-midnight).
Materials and Methods
Study design
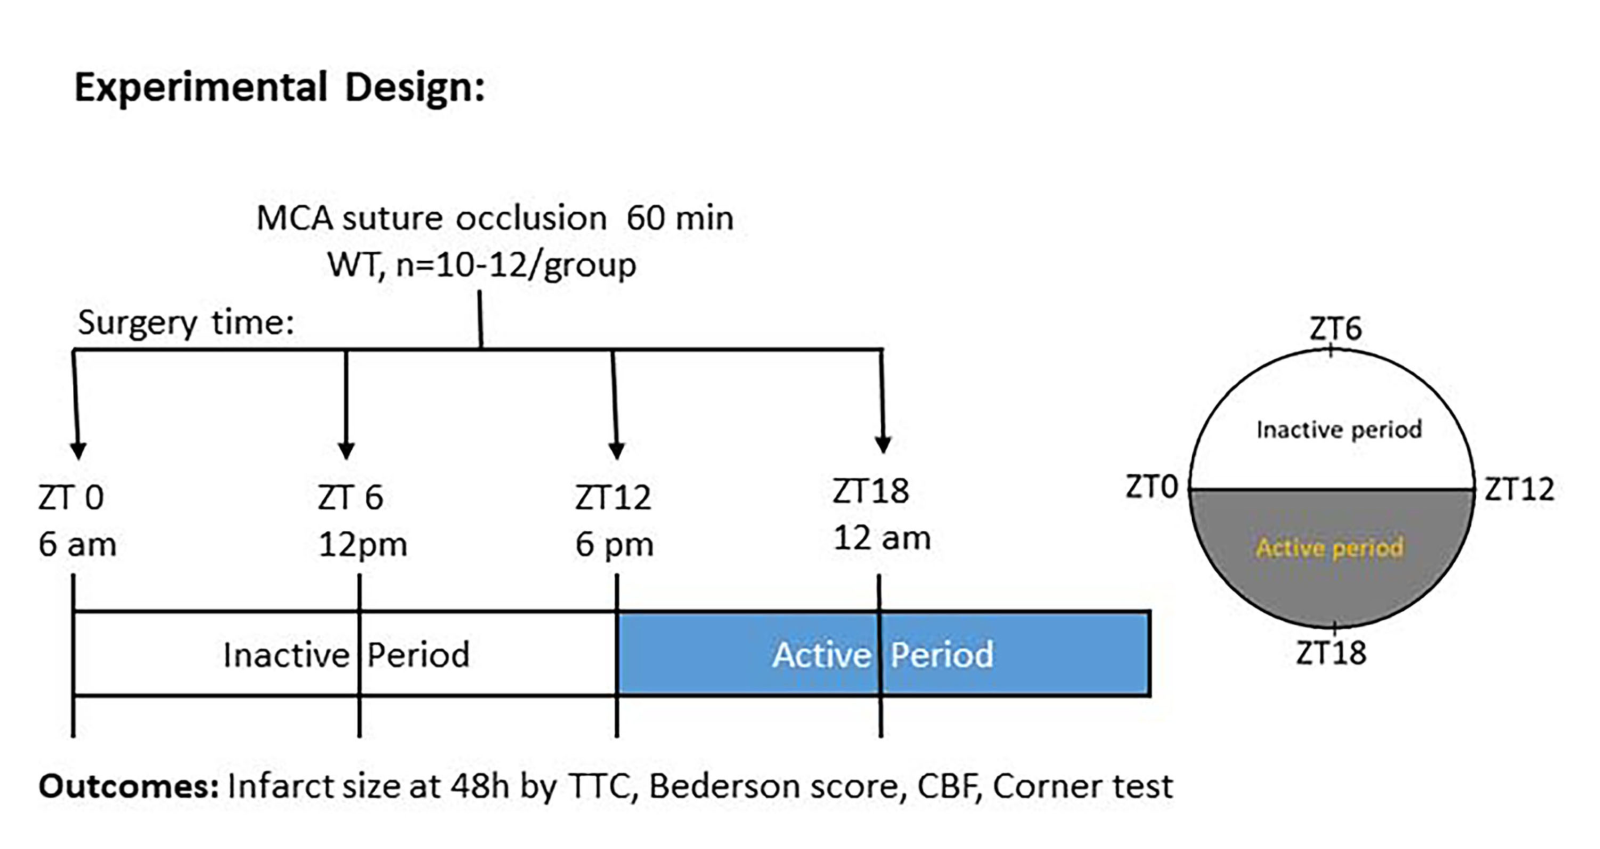
Experiments were performed in accordance with the ARRIVE guidelines (du Sert et al., 2020). Observers were blinded on all analysis of neurobehavioral tests and infarct volume. The stroke surgeon was not blinded to time of surgery as surgery was performed at ZT 0, 6, 12, and 18 (Fig.1).
Animals
Male, 7-8 month old C57BL/6J mice underwent MCAO. All the animal procedures, such as surgery, treatment, and functional outcomes were conducted according to the guidelines of the National Institutes of Health. The animal experimental protocol was approved by the Augusta University Institutional Animal Care and Use Committee (IUCAC). There was free access to food and water for mice during housing and experimentation. Mice were housed in a temperature and humidity controlled vivarium with alternating light-cycle environments (23.2 °C; 12-h light/dark cycle; lights on at 6 am and off at 6 pm).
Ischemic stroke
Cerebral ischemia was induced by occlusion of the MCAO) for 60 min using 6-0 monofilament (Cat# 602112PK10Re, 602212PK10Re, 602312PK10Re; Doccol Corporation, Sharon MA). The Doccol filament used was based on the weight of the mice. We used 602112PK10Re for 21 to 25 gm body weight, 602212PK10Re for 26 to 30 gm body weight, and 602312PK10Re for more than 30 gm body weight. The surgical procedure was performed under controlled anesthesia at a flow rate of 1.5% isoflurane. To keep body temperature optimal and controlled throughout the surgery, a regulated heating pad was used to minimize any adverse effects of hypothermia. Experiments were done over the circadian cycle, with lights on at 6 AM, and lights off at 6 PM, and so hours are recorded in zeitgeber time. We performed surgery at ZT0, ZT6, ZT12, and Z18. We did not reverse the light cycle. Surgery was done at actual time points. Postoperative care was given immediately after surgery, and the mice were kept in a temperature-controlled recovery area.
Mortality rate
Mortality curves were generated using the Kaplan-Meier test at different time points after acute stroke.
Cerebral blood flow measurement
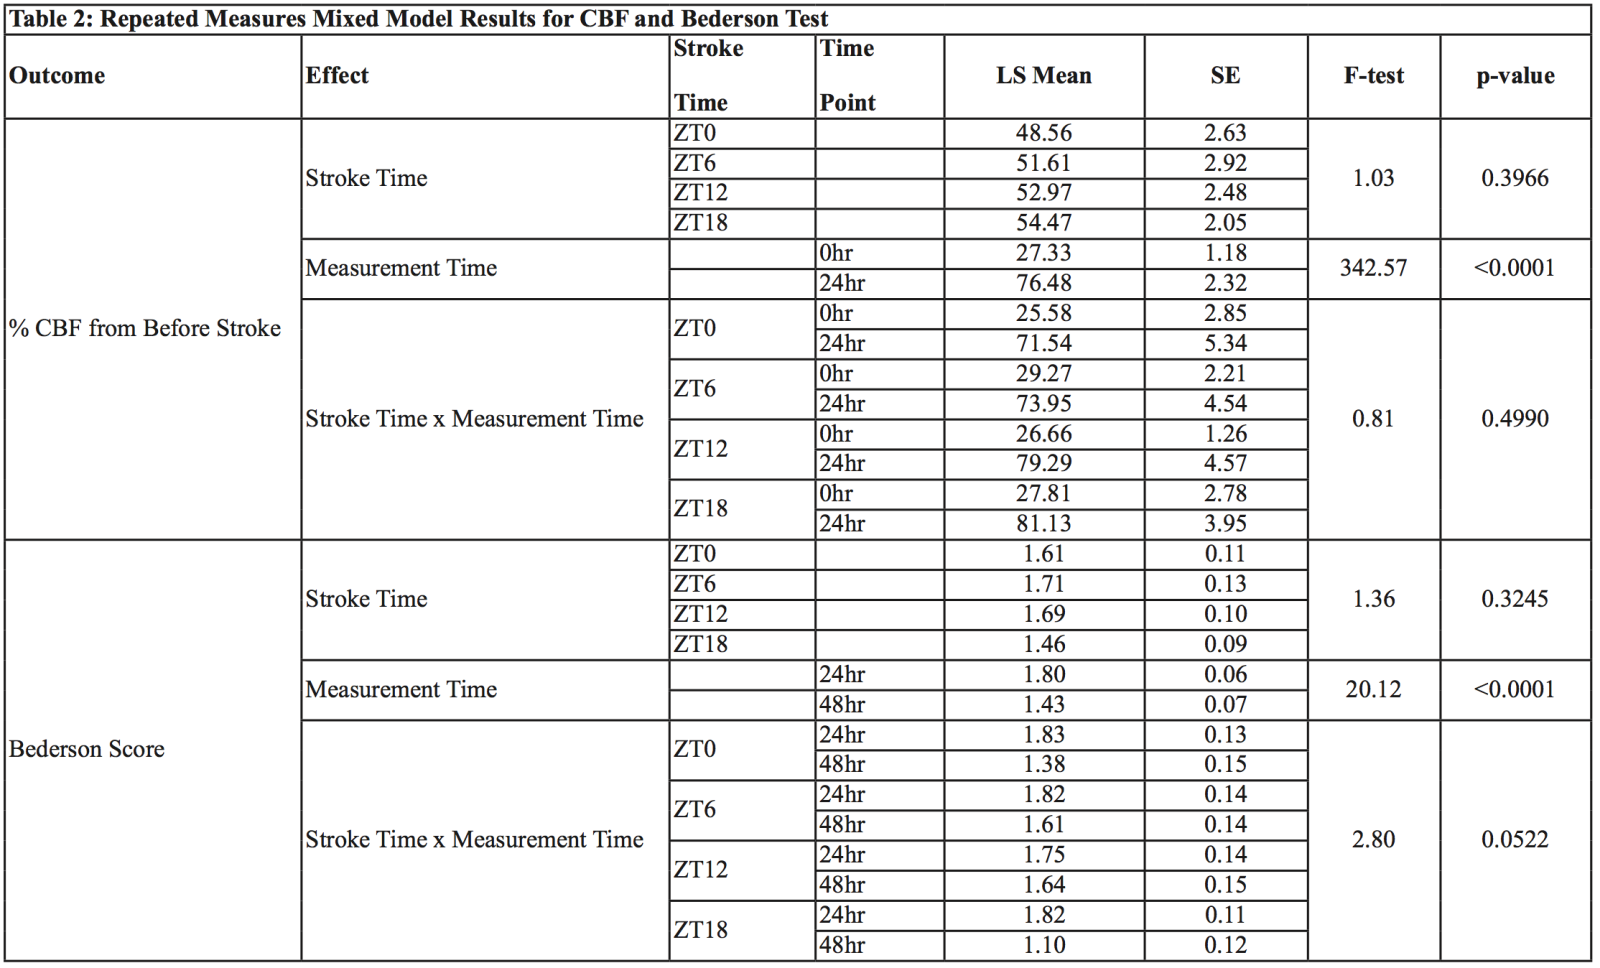
Cerebral blood flow (CBF) was monitored by Laser Speckle Contrast Imager (LSCI) (PSI system, Perimed Inc. City, State) before, after occlusion, and at different time points during the 24 hour period as indicated in the figure. Briefly, mice were placed under LSCI on a thermostatically controlled heating pad at 37°C to avoid any effect of body temperature fluctuation after stroke that can also interfere with CBF (Table 2).
Neurobehavioral function
Bederson score scale, measured using a grading scale of 0-3, was used to assess global neurological deficits after ischemic stroke. Scoring criteria include forelimb flexion, resistance to lateral push, and circling behavior. Mice were scored 24h and 48h after stroke (Table 2).
Corner test: The corner test was used to assess sensorimotor function and postural asymmetry in mice after stroke. This test identifies and quantifies sensorimotor asymmetries including contralateral deficits and ipsilateral turning. The apparatus consists of two boards placed closely together at a 30-degree angle to form a narrow corner. Mice were placed in the middle of the boards facing towards the corner. As mice reach the corner, both sides of the vibrissae lead the animal to turn left or right depending on the severity of the ischemic stroke. Mice with unilateral ischemic stroke will preferentially turn to the ipsilateral direction. We performed the corner test 48h of stroke.
Infarct size measurement
Infarct size measurement by 2,3,5-triphenynyltrazolium chloride (TTC) staining: At the terminal time point, mice were euthanized by decapitation under deep isoflurane anesthesia and the brains were carefully removed and washed with phosphate-buffered saline (PBS). The brains were coronally sectioned into 1-mm slices, which were then incubated and stained with 2% TTC and kept at 37˚C for 5 min. The brain infarct area (pale white) was quantified using NIH-Image J software.
Statistical Methods
All statistical analysis was performed using SAS 9.4 and statistical significance was assessed using an alpha level of 0.05. Descriptive statistics were determined within stroke time groups (ZT0, ZT6, ZT12, and ZT18) and measurement time (baseline, 24h, and 48h after stroke), and included frequencies and percentages for categorical variables (mortality), means and standard deviations for continuous measures (CBF measures, corner test, and TTC), and medians and interquartile ranges for ordinal variables (Bederson).
A Fisher’s Exact test, due to violation of the assumptions for the chi-square test, was used to examine differences in mortality between the four stroke time groups. To examine whether differences at 48h for the corner test and TTC staining were significant between the stroke time groups, one-way analysis of variance was run and post hoc pairwise testing between groups was performed using a Bonferroni multiple comparison procedure. Assumptions of normality and equality of variance were examined and if violations to these assumptions occurred the Welch ANOVA was performed with a Ryan-Elinot-Gabriel-Welsch multiple comparison procedure for post hoc pairwise tests.
For differences over time between stroke time groups (CBF at 24h and 48h, Bederson at 24h and 48h), repeated measures mixed model analysis was performed. For CBF the mixed model assumed an unstructured covariance structure with denominator degrees of freedom calculated using the Kenward-Roger method. For the Bederson outcome the mixed model used the ranks of the data, the minimum variance quadratic unbiased estimation of covariance parameters method of estimation, and a compound symmetric covariance structure. For the Bederson mixed model, the degrees of freedom of the denominator were calculated using the Kenward-Roger method for factors in the model that did not involve time, and for factors that did involve time the degrees of freedom of the denominator were infinity. Each model included fixed effects of the stroke time group and time, as well as the two-factor interaction between these effects. The F-test for the two-factor interaction term with measurement time was the statistical test of interest, and for the Bederson outcome the statistical significance of this F-test was determined using the Brunner, Domhof, and Langer method (Brunner et al., 2002). Post-hoc pairwise testing was performed using the Bonferroni multiple comparison procedure.
Results
No differences in mortality: Table 1 gives the descriptive statistics for each variable at the appropriate measurement time within each stroke time group. There was no statistically significant difference in mortality between the stroke time groups (Fisher’s Exact p = 1.0000).
No differences in CBF at occlusion and 24h after acute stroke at zeitgeber time points: CBF was significantly reduced after occlusion and had almost recovered at 24h. However, we could not observe any significant difference in CBF at any time point. Table 2 gives the results of the repeated measures mixed models. For CBF, there was no statistically significant interaction detected indicating that the pattern of the increase in percent CBF from baseline to 24hrs was not different between the four stroke time groups. There were statistically significant increases found from 0-24h within each group (p < 0.0001). Within the 0h time point there were no statistically significant differences among groups. Likewise, within the 24h time point there were no statistically significant differences among groups.

LS=Least Squares Mean, SE=Standard Error
Neurological deficit score at zeitgeber time points: Acute stroke was induced at zeitgeber time points at 6h intervals. Each mouse was subjected to behavioral tests to measure neurological deficit at 24h and 48h. For the Bederson score, a trend towards a statistically significant interaction (p = 0.0522) was detected indicating a different pattern of change in the Bederson scores from 24h to 48h among groups. The Bederson scores showed a much larger decrease from 24 to 48h in the ZT0 group but a lower decrease in the ZT6, ZT12, and ZT18 groups (Table 2). Within the ZT18 group from 24 to 48h the Bederson scores decreased significantly (p = 0.0025), but there was no statistically significant decrease detected in the ZT6, ZT12, or ZT18 groups. At 24h there were no statistically significant differences between stroke time groups. Likewise, at 48h there were no statistically significant differences between stroke time groups.
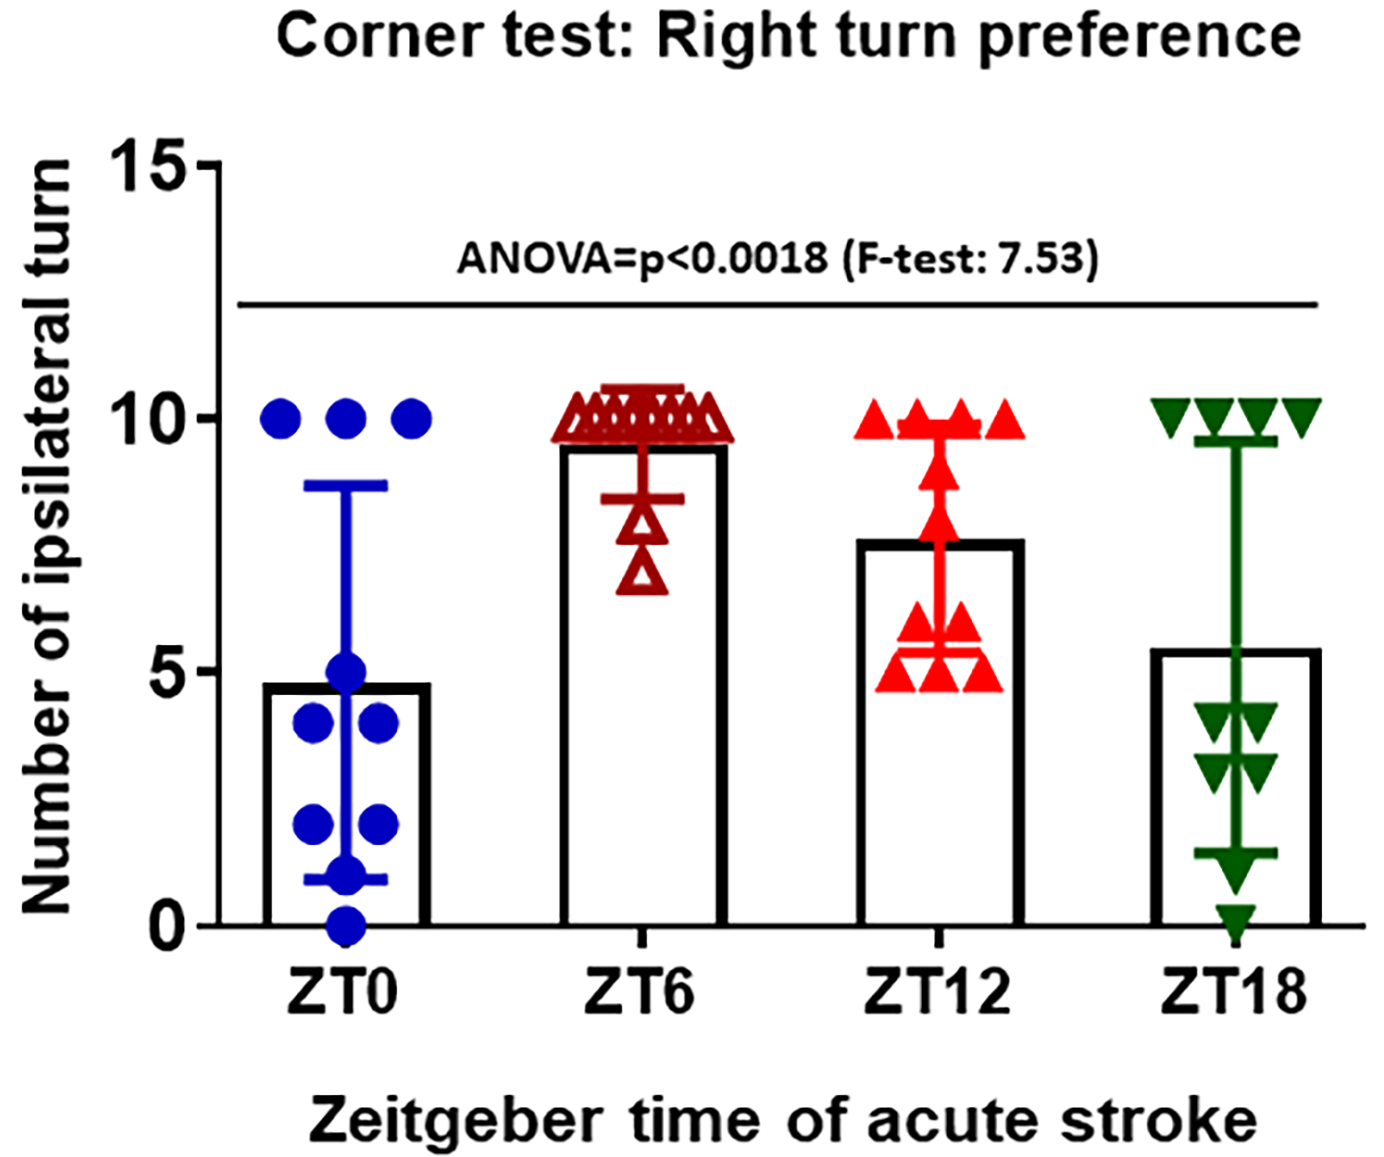
Circadian variation observed in the corner test score at discrete zeitgeber time points: We found a higher right turn preference at the sleep period, as compared to the other time points, in the corner test (Table 2). For the corner test, the homogeneity of variance assumption was violated, therefore the Welch’s ANOVA was performed. A statistically significant difference between the stroke time groups was detected and the Ryan-Elinot-Gabriel-Welsch multiple comparison procedure showed that ZT6 had a significantly greater mean corner test score than ZT0 and ZT18 (Fig. 2).

In a new window | Download PPT
Figure 2: Corner test were performed to count right and left turn after stroke at 48hr of acute stroke. Right turn represents the right turn preference in mice after stroke. Right turn preference was used to measure the sensorimotor function which eventually impaired by stroke pathology at ipsilateral side (n=10-12 mice/group) ANOVA=p<0.0018 (F-test: 7.53). †Homogeneity of Variance was violated (F=7.91, p=0.0003), Welch’s ANOVA was performed.
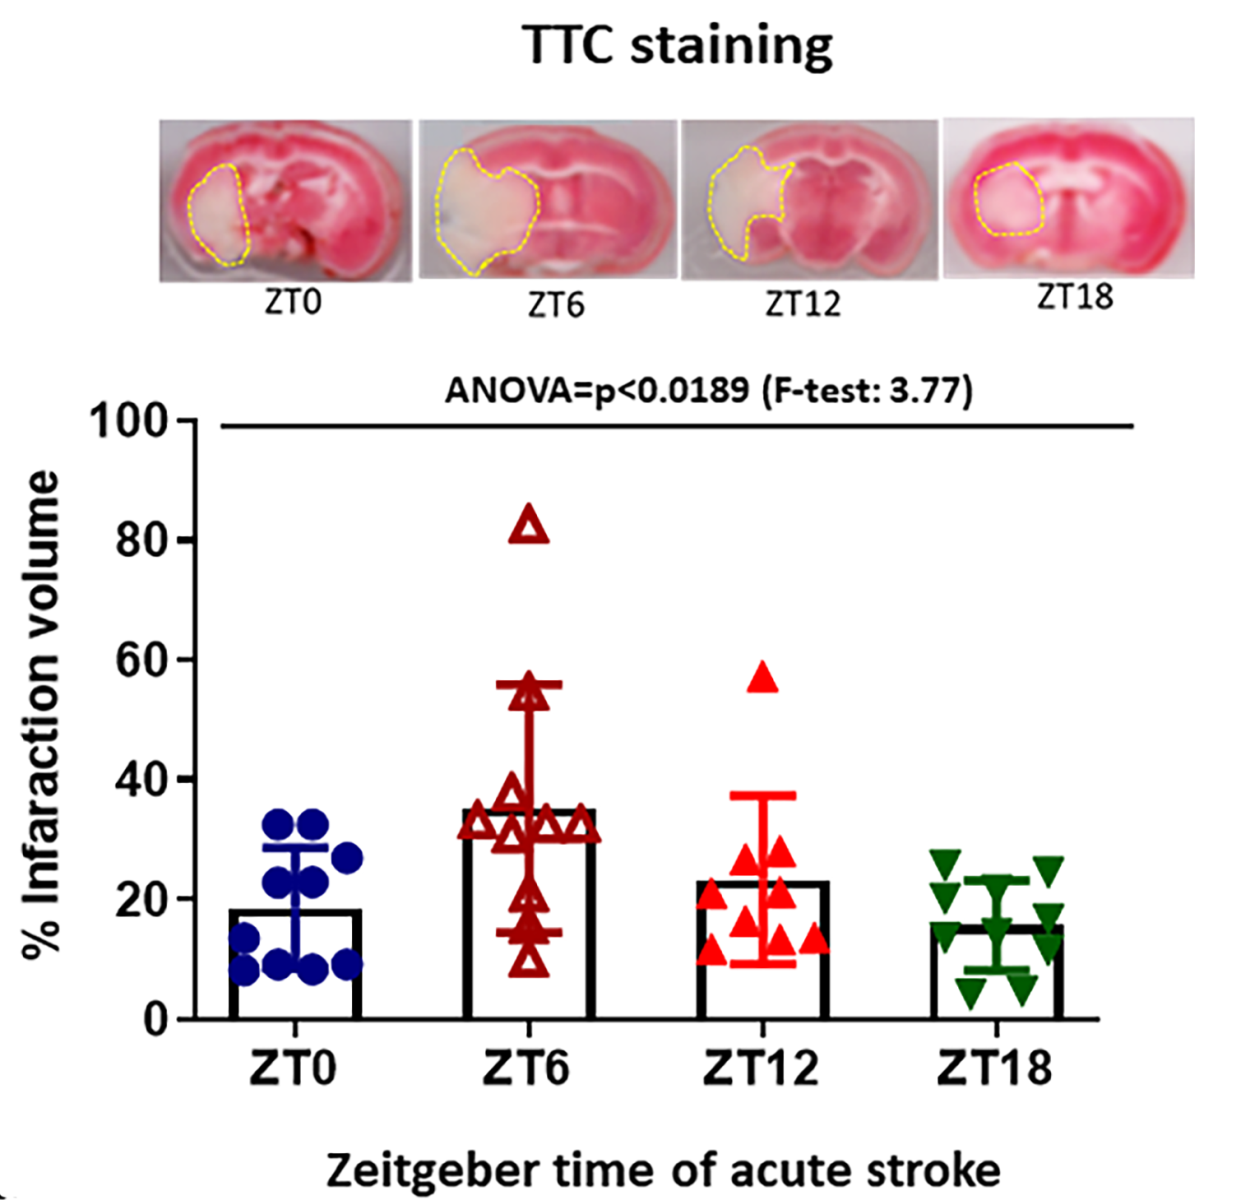
Infarction volume greatest at ZT6: TTC staining was performed to determine infarction volume at different time points. For TTC, the homogeneity of variance assumption was met, and one-way ANOVA was performed. A statistically significant difference between stroke time groups was detected and the Bonferroni multiple comparison procedure showed that the ZT6 group had significantly higher TTC than ZT18. This data suggest that stroke severity and infarction is higher during the sleep period (Fig.3).

In a new window | Download PPT
Figure 3: The infarct volume was observed by TTC staining of brain slices from each time points of stroke induction. The viable tissue was stained red color by TTC staining, but the infarcted/dead area remains unstained, exhibiting pale yellow/white color. Quantitative evaluation of percent infarction volume in different cohorts of mice was observed at 48h after MCAO. ‡ Homogeneity of Variance was verified (F=1.43, 0.2511).
Discussion
In this study, mice underwent MCAO at ZT0, ZT6, ZT12, and ZT18. Infarct size was largest and the corner test score was highest (indicating greatest sensorimotor deficit) at ZT6, a time of day that is the rest/sleep period for these nocturnal mammals. Recently, Esposito and colleagues (2020) found neuroprotective agents to be effective in rodents during ZT 3-9, the sleep or inactive time for rodents but not effective at ZT 15-21, the rodent active time. Most research laboratories perform rodent surgery during the daytime, when rodents typically sleep, yet, most human strokes occur during the awake/active time. Thus, circadian differences in the occurrence and treatment of stroke may explain the lack of translation of rodent preclinical work to the clinical arena.
We used a narrower window of performing MCAO at specific times, not during a range of times. It appears that our findings are in line with Esposito and colleagues (2020). Although not a direct comparison, the ZT3-9-time infarcts in their study tended to be larger than the ZT15-21 infarcts, which is consistent with our findings.
In a pooled analysis of 583 patients with anterior circulation large vessel occlusion who underwent computer tomography perfusion, infarct cores were larger at night than during the day (40.2 ml vs. 33.1 ml) and infarct growth was faster (Reidler et al., 2021). Sinusoidal analysis showed peak core infarct volume in strokes with onset at 11 pm. In our study we find a similar infarct volume largest at noon, the sleep period for rodents.
We did not find changes in CBF by LCSI, nor could we detect major changes in surface CBF to explain the larger infarcts and worse outcomes. However, potential mechanisms include changes in inflammation, mitochondrial function, and oxidative stress.
Limitation of study: Limitations of our study include the small number of mice, the use of only young male mice, and measurement of only short-term outcome (48h). We also did not reverse the lighting to blind the surgeon. Moreover, we have not yet studied the biological mechanisms of this effect.
Conclusions: Our study clearly suggests that sleep and awake periods of stroke occurrence have differential outcomes in infarct volume and neurobehavioral outcomes. Infarct size and short-term outcome is worse at noon (the sleep period) than at other time points. These findings require replication in other laboratories and in larger groups of rodents. Our future plan includes using the NIH SPAN Network, a preclinical network of 6 centers with unbiased and standardized operating procedures and a large sample size to determine if these findings can be replicated and if there are gender or age effects.
Contribution
PK performed the surgery, literature review, wrote manuscript, KW performed behavioral outcomes, TTC staining, and quantification. MBK measured CBF, analyzed the data, and the edited manuscript. SS generated the mice and edited the manuscript. DCH generated the idea, reviewed the literature, and wrote the manuscript. JW performed the statistical analysis. KD and DR reviewed and edited the manuscript.
Acknowledgment and Sources of Funding
The authors greatly acknowledge NIH Funding (R01 NS099455, 1UO1Ns113356, and R01 NS112511) to David C. Hess to conduct this experiment.
Disclosures
The authors do not have any conflict of interests.
References
Pradip K. Kamat1
1Departments of Neurology, Medical College of Georgia. Augusta University.
Mohammad Badruzzaman Khan1
1Departments of Neurology, Medical College of Georgia. Augusta University.
Kristofer Wood1
1Departments of Neurology, Medical College of Georgia. Augusta University.
Shahneela Siddiqui1
1Departments of Neurology, Medical College of Georgia. Augusta University.
Daniel R Rudic2
2Department of Pharmacology, Medical College of Georgia, Augusta University.
Krishnan Dhandapani3
3Department of Neurosurgery, Medical College of Georgia, Augusta University.
Jennifer Waller4
4Department of Biostatistics & Data Sciences, Medical College of Georgia. Augusta University.
David C. Hess1
1Departments of Neurology, Medical College of Georgia. Augusta University.
Corresponding author:
Pradip Kamat PhD
Email: pkamat@augusta.edu

In a new window | Download PPT
Figure 2: Corner test were performed to count right and left turn after stroke at 48hr of acute stroke. Right turn represents the right turn preference in mice after stroke. Right turn preference was used to measure the sensorimotor function which eventually impaired by stroke pathology at ipsilateral side (n=10-12 mice/group) ANOVA=p<0.0018 (F-test: 7.53). †Homogeneity of Variance was violated (F=7.91, p=0.0003), Welch’s ANOVA was performed.

In a new window | Download PPT
Figure 3: The infarct volume was observed by TTC staining of brain slices from each time points of stroke induction. The viable tissue was stained red color by TTC staining, but the infarcted/dead area remains unstained, exhibiting pale yellow/white color. Quantitative evaluation of percent infarction volume in different cohorts of mice was observed at 48h after MCAO. ‡ Homogeneity of Variance was verified (F=1.43, 0.2511).
Supporting Information
Metrics
| Full-Text | Supporting Information | ||
|---|---|---|---|
| Number | 8727 | 24 | 0 |
Copyright © 2017 Conditioning Medicine, All Rights Reserved.
Address: Conditioning Medicine Editorial Office, 3500 Terrace Street, Pittsburgh, PA, 15213, USA
